GUIDE: How to Read and Plot on an Ordnance Survey Map
Over the coming months we will be developing Guides on how to navigate rallies. This first Guide will be something every navigator must do on a road rally – reading and plotting points on your Ordnance Survey maps (OS maps).
What is an Ordnance Survey map and how are they used?
Ordnance Survey is the national mapping agency for Great Britain, relied upon to have the most up-to-date geographical information for government agencies, businesses and individuals to understand an area and its terrain, without the need for a physical visit. Their maps are also used by motorsport Clubs throughout the UK, to plan and deliver road and navigational rally events on the public highway. These events most commonly use the 1:50000 Landranger map.
How to read a grid reference
When competing in a rally, you are likely to be given six figure grid references. Although they may look intimidating, they are easy to read when broken down. On any page in your OS map, you will see a faint blue grid with numbers for both the horizontal and vertical aspects.
The key point is to remember the phrase many of us learned in our maths lessons at school – ‘along the corridor, and up the stairs.’ This is the order in which plot points are written – the first half of the reference relates to the X-axis (the corridor), and the second half the Y-axis (the stairs).
For example, for the grid reference 592244, the first three numbers (592) refer to the X-axis, and the second three (244) to the Y-axis. We start then with line number 59 on the bottom, and 24 on the side. The third and sixth numbers come into play later.
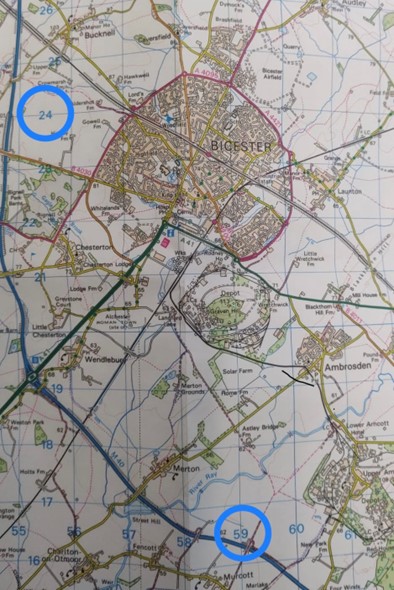
Where these lines interject, consider this the bottom left of the square where your plot point is, highlighted below in red.
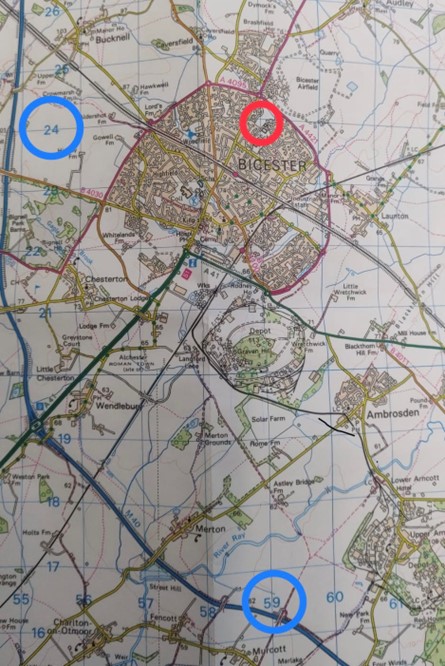
Now we use those third and sixth numbers to find the exact plot point in this square. With grid reference 592244, we’re looking at 2 and 4.
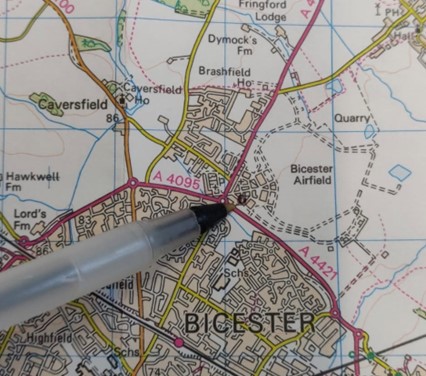
Along the corridor and up the stairs applies here too. Divide your box (59 along, 24 up) into another grid, where both the horizontal and vertical are separated into 10 equal segments. Our numbers (2 and 4) then mean that our exact plot point lies at the intersection of 2/10 along the bottom and 4/10 up the box. This is where we mark our spot.
What you will need
A map – OS maps can be purchased from most high street outdoor stores, or from Ordnance Survey themselves. When entering an event, the organising club will tell you which map you need to purchase. The maps are typically under £10 and can be reused across multiple events in the same area.
Romer – When plotting your points on a map, it can often be easier to use a romer to break the square down into those 10 by 10 segments. Romers can be purchased here, for around £2, and are a helpful tool to ensure you have an accurate plot point.
Ahead of your first rally event, you can practice your plotting by identifying the grid references of nearby landmarks.
In our next Guide, we will talk about communication for navigators on road rallies: how to instruct your driver and how to respond to feedback.
"*" indicates required fields